LCA Methodology and Indicators
LCA Methodology
LCA is a way to see how a product affects the environment from start to finish, including making it, moving it around, using it, and throwing it away. It looks at how much energy and materials it takes to make something and how it affects the air, water, and soil. It gives us a big picture of how good or bad something is for the environment.
It is standardized by ISO 14040 and 14044.
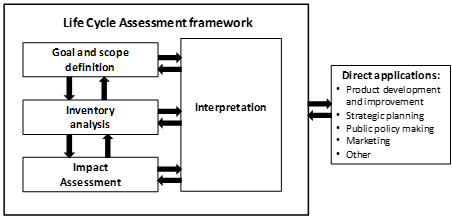
LCA is an iterative process. This means you have to look at your goals and plans in each step of the way; if the data obtained in the inventory are not sufficient or if the results of the impact assessment indicate that the objectives cannot be achieved. they should be reconsidered accordingly.
Goal and scope definition
The first step in the LCA assessment is crucial, as it involves defining the objectives, target audience and rationale for the study. This is essential in order to make informed decisions about how to research the product or service under consideration.
During this step, it is important to have a clear understanding of what is being analysed, for how long and where. The boundaries of the system under study should be clearly defined, including conceptual, geographical and temporal limits. The quality of the data and the types of information sought should also be established, such as the assumptions made, the impact categories chosen, the allocation rules and the limitations of the study.
Finally, it is important to determine the functional unit of the product or service being evaluated or compared. This unit should relate to the quantity of product required to perform a given function rather than simply being expressed in terms of quantity of product. By taking all these factors into account, informed decisions can be made on how to proceed with the LCA study.
Inventory analysis
The second step in LCA is where you start collecting data about the thing you’re studying. You gotta figure out how much stuff is going in and coming out of the thing you’re looking at (compilation and quantification of inputs and outputs), and make sure it’s all measured in the same way.
- Consumption of materials
- Energy resources
- Emissions to water, air, and soil
- Products
To make it easier, you divide the thing you’re looking at into smaller parts or subsystems and see how much stuff is going in and coming out of each part. Then you group all the data together in a big table (Life Cycle Inventory) so you can look at it all at once.
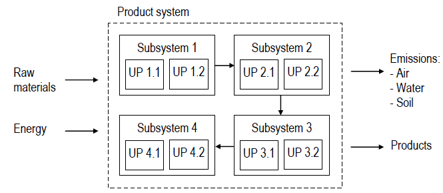
In this phase of LCA, inputs and outputs of the product or service under study are quantified and compiled, and then referred to the functional unit selected in the previous phase. However, it can get complicated when there are co-products produced by the system. In such cases, ISO standards recommend avoiding allocation when possible by including all co-products in the scope of the study, or using system expansion by finding an independent process that produces one of the co-products not related to the system under study. If neither option is feasible, allocation using properties such as mass, energy content, or economic value is recommended.
Impact assessment
Life Cycle Impact Assessment (LCIA) is about understanding the environmental impact of the data collected in the inventory phase. It simplifies the data by turning it into a few impact category indicators like global warming, acidification, ozone layer depletion, or ecotoxicity.
LCIA typically involves several steps, including:
- Classification: This simply means sorting the inventory flows or substances according to the impact categories they contribute to.
- Characterization: This step consists of quantifying the contribution of the substances classified in each impact category. expressed in a common unit. This is done by using “characterization factors”; factors that show the relative contribution of one singular emission at a given impact category using a reference unit.
- Normalization: This step involves comparing the results of the previous steps to reference values, which provides a perspective on the relative significance of the results.
- Grouping: This step involves combining the results of the previous steps into a smaller number of indicator scores (such as global/regional/local impacts or impacts with high/medium/low priority).
- Weighting: This step consists of converting the environmental profile to a single impact score. by means of using “weighting factors” based on subjective value judgments. The advantage of doing so is that the different impact categories (measured in different units) are transformed into a numerical score of environmental impact, thus facilitating decision-making. At the same time, the biggest drawback is that those weighting factors are mainly based on political criteria with hardly any scientific basis. Moreover, a lot of information is lost, and reality is oversimplified.
The first two steps (classification and characterization) are mandatory in LCA according to ISO standards, whereas the last three steps (normalization, grouping, and weighting) are optional and can be adapted to the specific needs of the study.
Interpretation
This is the last phase of an LCA (although. as explained above. it runs in parallel with the others). Here. the results obtained in the inventory and in the impact assessment are interpreted. while considering the defined goal and the limitations defined by the scope of the study. and recommendations for reducing the environmental impact of the analyzed system are formulated. Interpretation involves a review of all the previous phases of the analysis. in order to assess the consistency of the assumptions taken and the data quality. In the interpretation of the results. techniques such as sensitivity analysis. assessment of the limitations of the study and an external review must also be taken into account.
Environmental Impact Categories
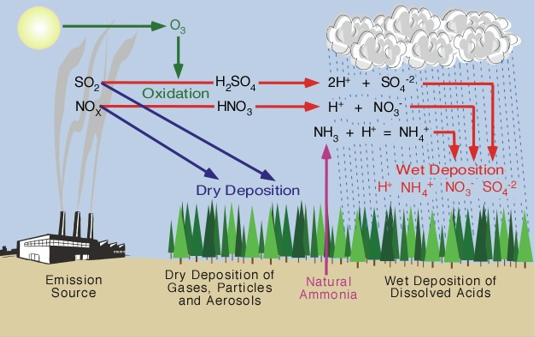
Acidification
Acidifying substances such as sulphur dioxide (SO2) and nitrogen oxides (NOx), predominantly emitted through fossil fuel combustion, can remain in the atmosphere for a few days and be transported over great distances. When converted chemically into acids (sulphuric and nitric), they deposit into the soil and surface water, leading to changes in their chemical composition. This can harm ecosystems and cause acidification, as evidenced by the decline of forests in Central and Eastern Europe, and the proliferation of ‘dead’ lakes in Scandinavia and Canada. Acidification is quantified in terms of mole of H+ eq as an impact category in LCA.
Cancer human health effects
Cancer is a disease that results from genetic mutations that disrupt normal cell functions. Some of these mutations happen naturally during the replication of DNA when cells divide, but others occur due to exposure to environmental factors that damage DNA. These environmental factors can include various substances, like the chemicals found in tobacco smoke, or radiation, such as the ultraviolet rays in sunlight. In LCA, the impact category for cancer is typically measured in Comparative Toxic Units for humans (CTUh).
Climate Change
Climate change is an impact category that focuses on the global warming caused by human-induced greenhouse gas emissions. The majority of these emissions come from the burning of fossil fuels for energy consumption, as well as from agriculture, deforestation, and industrial processes. Carbon dioxide (CO2) and methane (CH4) are the primary greenhouse gases, accounting for more than 90% of emissions. Climate change leads to various consequences, including rising temperatures, more frequent droughts and wildfires, changing rainfall patterns, and melting of glaciers and snow. Another impact of climate change is the rising of the global mean sea level. This impact category is typically measured in Global Warming Potential (GWP) or Carbon Footprint.
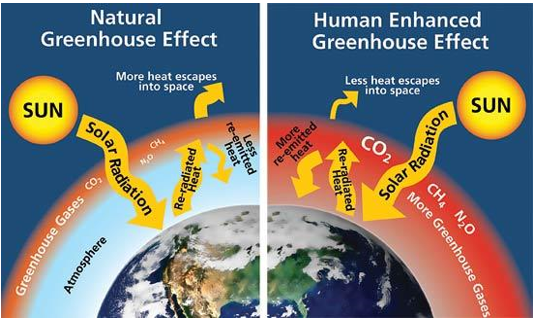
This impact category is measured in kg of carbon dioxide equivalents.
Climate change fossil is referred to the part of climate change that is caused by the use and combustion of fossil fuels. Thus, greenhouse gas emissions from biogenic sources (such as wood. paper or cardboard production) are not considered.
Ecotoxicity freshwater
Ecotoxicity freshwater refers to the impact on fresh water ecosystems, as a result of emissions of toxic substances to air, water and soil. Ecotoxicity Potential is calculated taking into account fate, exposure and effects of toxic substances. The time horizon is infinite. This impact category is measured in Comparative Toxic Unit for ecosystems (CTUe).
Eutrophication (terrestrial. freshwater and marine)
The overloading of seas. lakes. rivers and streams with nutrients (nitrogen and phosphorus) can result in a series of adverse effects known as eutrophication. Phosphorus is the key nutrient for eutrophication in fresh waters and nitrate is the key substance for salt waters.
In severe cases of eutrophication. massive blooms of algae (sessile and planktonic) occur. Some blooms are toxic. As dead algae decompose. the oxygen in the water is used up; bottom-dwelling animals die and fish either die or leave the affected area. Increased nutrient concentrations can also lead to changes in the aquatic vegetation. The unbalanced ecosystem and changed chemical composition make the water body unsuitable for recreational and other uses. and the water becomes unacceptable for human consumption. High concentrations of nitrate in drinking water are considered a human-health problem because in the stomach nitrate is converted rapidly to nitrite. which can cause a reduction in the blood’s oxygen-carrying capacity.
The main source of nitrogen pollution is run-off from agricultural land. whereas most phosphorus pollution comes from households and industry. The rapid increase in industrial production and household consumption during the 20th century has resulted in greater volumes of nutrient-rich wastewater. Nutrient removal during wastewater treatment in sewage-treatment plants is vital to minimise the impact of nitrogen and phosphorus pollution on Europe’s water bodies.
This impact category is measured in fraction of nutrients reaching freshwater end compartment (P) [kg P eq.] for eutrophication freshwater; in fraction of nutrients reaching marine end compartment (N) [kg N eq.] for eutrophication marine; and in accumulated exceedance [mole of N eq.] for eutrophication terrestrial
Ionizing radiation, human health
This impact category is referred to the damage on human health related to the routine releases of radioactive material to the environment. It takes into account fate and exposure. This impact category is measured in a Human Health effect model and expressed in kg of uranium 235 equivalents released to the air [kg U235 eq. to air].
Land Use
There are different models and approaches to evaluate the effects on land use due to human intervention. Although none of them has been completely agreed by the scientific community, this impact category is usually measured using a soil quality index (biotic production, erosion resistance and mechanical filtration) based on soil organic matter content and expressed in points [Pt].
Human toxicity, non-cancer
Non-cancer human health effects refer to the risks associated with exposure to various substances through different means (oral, dermal, or inhalation) that are not related to cancer. The impact category assesses the effects based on the minimum risk level, reference dose, and reference concentration that estimate the doses and exposures unlikely to cause non-carcinogenic health effects. Reference concentrations apply to potential non-cancer effects from inhalation. The impact is measured in Comparative Toxic Unit for humans (CTUh).
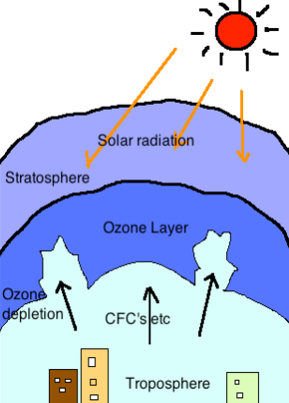
Ozone depletion
Ozone depletion includes two related events that have occurred since the late 1970s: a gradual decrease of around four percent in the total amount of ozone in the Earth’s atmosphere (the ozone layer), and a much larger springtime decline in stratospheric ozone around the polar region, known as the ozone hole. In addition to these stratospheric events, there are also springtime polar tropospheric ozone depletion events. The primary cause of ozone depletion and the ozone hole is human-made chemicals, including refrigerants, solvents, and propellants, all referred to as ozone-depleting substances (ODS). These substances are transported into the stratosphere and catalyze the breakdown of ozone into oxygen. The impact category is measured in ozone depletion potential and expressed in kg CFC-11 eq.
Photochemical ozone formation, human health
Ozone is formed in the troposphere under the influence of sunlight when nitrogen oxides are present. When organic volatile compounds (VOC’s) are also present, peroxy radicals can be produced. Peroxy radicals are highly reactive and toxic compounds, and the presence of peroxy radicals can result in an increase of the concentration of ozone through a complex reaction pattern. Ozone is a secondary pollutant. as there is practically no ozone present in source emissions derived from human activity.
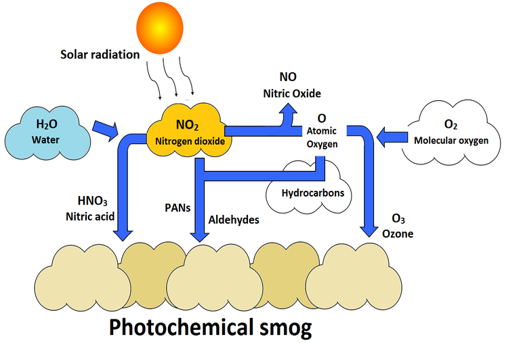
Tropospheric ozone, also known as ground-level ozone, is a significant environmental threat on a regional scale. It is harmful to human health at high concentrations and can cause damage to vegetation even at lower concentrations. Ozone is a transboundary pollutant that can be produced or consumed by other pollutants during long-range transport. The health impacts of ozone have traditionally been attributed to high peaks in ozone concentration, known as ozone episodes. The impact category is measured in tropospheric ozone concentration increase and expressed in non-methane volatile organic compounds equivalents (kg NMVOC eq).
Resource use, fossils
This indicator evaluates the use of resources with energy carriers from fossil fuels, using reserve base as reference for resources stock. This impact category is measured in abiotic resource depletion-fossil fuels (ADP-fossil) and expressed in MJ.
Resource use, minerals and metals
This indicator evaluates the use of mineral and metal resources. using reserve base as reference for resources stock. This impact category is measured in abiotic resource depletion (ADP-ultimate reserves) and expressed in kg of antimony equivalents [kg Sb eq.].
Particulate matter
This indicator evaluates the effects on human disease (chronic long term mortality and chronic bronchitis) due to the inhalation of fine particulate matter. below 2.5 μm. There are different models and methods to estimate this effect. all of them based on exposure and fate. This impact category is measured in disease incidence.
Water use
Water scarcity is a pressing issue as demand is outpacing supply, with estimates suggesting a potential shortage of over 40% by 2030 if no action is taken. Increased human water use has doubled in the past 50 years, leading to low flows in various regions and threats to freshwater availability due to population growth, demand for food, and climate change. Global food demand for 2050 could intensify water stress, posing risks to both human water security and ecosystems. Approximately half of the world’s major river basins experience water scarcity, with restrictions projected to increase due to climate change. The water use indicator assesses potential scarcity and is measured in scarcity-adjusted water use expressed in m3 world eq.